


Abstract
BACKGROUND: Given the lack of consensus about the effect of traffic‐derived pollutants on male fertility, we evaluated semen quality in men occupationally exposed to traffic. METHODS: Semen quality was investigated in 85 men employed at motorway tollgates and in 85 age‐matched men living in the same area. Semen, circulating sex hormones, methaemoglobin, sulphaemoglobin, carboxyhaemoglobin, lead (Pb) and zinc (Zn) protoporphyrin were assayed. Environmental carbonium oxide, nitrogen oxide, sulphur oxide and Pb were also measured. RESULTS: Sperm count, and serum levels of FSH, LH and testosterone were within normal range in both groups. Total motility, forward progression, functional tests and sperm kinetics were significantly lower in tollgate workers versus controls. In a subset of tollgate workers with motility below normal, methaemoglobin was inversely correlated with total motility, viability, the hypo‐osmotic swelling test, the acridine orange test, the cervical mucus penetration test, linearity, and amplitude of lateral movement of the sperm head, whereas blood levels of Pb were inversely correlated with viability and sperm count. CONCLUSIONS: The finding that blood methaemoglobin and Pb were inversely correlated with sperm parameters indicates that nitrogen oxide and Pb adversely affect semen quality.
Introduction
Although increased environmental chemical pollution has been implicated in poor sperm quality, a correlation between pollution and fertility has yet to be demonstrated (Carlsen et al., 1992; Forti and Serio, 1993; Jensen et al., 2002). 1,2‐Dibromo‐3‐chloropropane (DBCP) has been found to be spermatotoxic (Whorton et al., 1977). Subsequently, it was shown that the pesticides lindane, carbaryl, and 2,4‐dichlorophenoxyacetate (Whorton et al., 1979), solvents such as glycol ethers and carbonium disulphur (Veulemans et al., 1993), and the heavy metals lead (Pb) and cadmium (Cd) (Dawson et al., 1998) damaged testicular function. Chemicals also caused genital tract malformations such as hypospadias, cryptorchidism and feminization (Sultan et al., 2001), and altered sexual behaviour and reduced fertility in humans and wildlife (Colborn et al., 1993; Daston et al., 1997; Tyler et al., 1998). Occupational exposure to traffic pollution has been reported to reduce semen quality (Figà‐Talamanca et al., 1996; Tielemans et al., 1999). Furthermore, the incidence of childlessness and of difficulty in conceiving was enhanced in workers exposed to elevated temperatures even though the only difference in semen quality was reduced sperm velocity (Figà‐Talamanca et al., 1992). Watanabe and Oonuki (1999) demonstrated that diesel engine exhaust stimulated hormonal secretion, depressed GnRH and inhibited spermatogenesis in rats. It has also been suggested that occupational Pb exposure slightly reduces sperm production, an effect that could be at least partially reversible (Viskum et al., 1999). However, in another study, Cd and Pb concentrations in sperm were not correlated with any of the parameters of semen analysis (Hovatta et al., 1998), and paternal exposure to Pb was not associated with decreased fertility (Sallmen et al., 2000).
We conducted this observational, analytical, prospective case–control study to evaluate whether continuous exposure to traffic‐derived environmental pollutants adversely affects male fertility.
Subjects and methods
Subjects
A total of 115 men (age 23–62 years; median 37) working at a motorway tollgate (for 6.2 ± 1.6 years) were interviewed for their medical history and underwent a complete physical examination, laboratory evaluation and endocrine screening. Thirty men were subsequently excluded from the study because of current systemic diseases, acute orchitis or infection of the genital tract, abnormal location and size of the testis, genital inflammation, seminal pathway obstructions, alcohol or drug abuse, recent hormonal treatment or neoplasm, or azoospermia not related to environmental pollution (chromosomal abnormalities, previous orchitis or trauma, cryptorchidism). The remaining 85 men constituted the study population: all were free of other significant illnesses, and none used medications known to affect pituitary or gonadal function. Each subject gave his informed consent to the study. Eighty‐five men randomly recruited among clerks, drivers, students and doctors age‐matched with the study population and living in the same geographical area without any known disease served as controls. Controls were not occupationally exposed to pollutants, but were exposed to the same level of environmental pollution as the local general population.
Study protocol
The study was performed from January 2000 to January 2002. All 170 subjects were interviewed about the family lifestyle. They were asked the number of months of unprotected intercourse before the couple’s first pregnancy (time to pregnancy; TTP). Serum FSH, LH and total testosterone levels and semen analysis were measured to evaluate gonadal function. The concentrations of carbon monoxide (CO), nitrogen oxide (NO), sulphur oxide (SO) and Pb were measured at eight tollgates and at eight sites in the urban area where the 170 subjects live. Blood levels of methaemoglobin (MHb), sulphaemoglobin (SHb), carboxyhaemoglobin (COHb), Pb, zinc protoporphyrin (ZnPP), which are biological markers of environmental pollution, were assayed in all subjects.
Hormonal assay
Serum levels of FSH (reference range = 0.7–11.1 IU/l), LH (reference range = 0.8–7.6 IU/l) and testosterone (reference range = 2.8–15.1 μg/l) were determined with a chemiluminescent enzyme immunometric assay using commercially available kits and the Immulite® automated analyser (Diagnostic Products Corporation, USA; Medical System, Italy). Intra‐ and inter‐assay coefficients of variation were respectively: FSH: 5.4 and 6.5%; LH: 4.8 and 8.1%; testosterone: 4.3 and 6.5%.
Semen analysis
Semen was analysed according to the World Health Organization (World Health Organization, 1999) guidelines. Seminal fluid samples were obtained by masturbation after 3–5 days of sexual abstinence. After collection, the ejaculates were left to liquefy for 30 min at room temperature. Sperm count and motility were evaluated with the Makler Counting Chamber; sperm morphology was evaluated at the optical microscope (×40 magnification) after dilution of sperm (1:1) in phosphate‐buffered saline and Giemsa staining.
The live sperm count (normal range ≥75%) was evaluated with the eosin test, sperm membrane function (normal range ≥60%) with the hypo‐osmotic swelling test (HOS), the sperm kinetic index (normal range ≥30 mm) within bovine cervical mucus penetration test (CMPT), and sperm nuclear DNA integrity (normal range ≥70%) with the acridine orange test.
Sperm kinetics were evaluated by computer‐assisted sperm analysis with the Cell Track/S® apparatus (Motion Analysis Corporation, USA) to determine sperm curvilinear velocity (VCL) (normal range ≥46 µm/s), sperm linear velocity (VSL) (normal range ≥25 µm/s), the linearity of sperm motion (LIN = VSL/VCL) (normal range ≥58%) and the amplitude of lateral movement of the sperm head (ALH) (normal range ≥1.5 µm).
Environmental pollutants assay
The gaseous pollutants NO and SO were measured with specific analysers (Babuc, L.S.I., Italy) for 24 h in summer (June and July) and in winter (December and January) at eight tollgates and at eight sites in the area were the 170 subjects lived. Atmospheric Pb was concentrated on porous filters by a suction pump (Bravo; TCR Tecpora, Italy) and the filters were analysed in atomic absorption (Branderberger, 1967). The maximum occupational exposure to these pollutants according to Italian legislation, is <80 <200 µg/m3 for 1 h/24 h for NO; <120 µg/m3/24 h for CO; <40 mg/m3/24 h for Pb; <2 µg/m3/24 h for SO.
Toxicological evaluation
Absorption of environmental pollutants was evaluated by specific dose‐and‐effect gauges: MHb for nitrogen dioxide, SHb for sulphur dioxide, COHb for carbonium oxide, circulating blood Pb and ZnPP for environmental Pb (Schifman and Finley, 1981). The percentage concentrations of MHb (normal range <1.5% Hb), SHb (normal range <1.2% Hb) and COHb (normal range: for smokers <8% Hb; for non smokers <2.5% Hb) were measured by the oxymetric method (OSM3; Radiometer, Denmark) (Kelner and Bailey, 1985). Environmental Pb levels (normal range <20 µg/dl) were measured by spectral analysis in atomic absorption, and ZnPP levels (normal range <40 µg/dl) with the fluorimetric method.
Statistical analysis
Continuous data were expressed as mean ± SEM and data obtained in the study and control groups were compared by the two‐tailed t‐test for unpaired data. Categorical data (married subjects in the control and study groups) were expressed as percentages and compared by the Yates’ corrected χ2‐test. Based on values established by the World Health Organization (WHO) (see above), the study group was divided into two subsets: 30 subjects with normal total sperm motility (subset 1) and 52 with deranged sperm total motility (subset 2). We used linear regression analysis to correlate seminal variables and environmental pollutants and toxicological markers in the study group as a whole and in the two subsets. P < 0.05 was considered significant.
Results
Family history
Seventy‐one tollgate workers (83.5%) and 63 controls (74.1%) were married. The mean number of children was 1.8 ± 0.1 (range 0–4) in the study group, 2.0 ± 0.1 (range 0–4) in the control group. Seven of the 71 married tollgate workers (9.9%) and one of the 63 (1.6%) married controls were childless, but the latter’s wife was pregnant. The general mean TTP was 15.0 ± 1.6 months (range 0–60) in the study group and 8.1 ± 0.4 months (range 0–15) in the control group (P < 0.0001) (Table I).
Hormonal assay
The mean levels of FSH, LH and testosterone were normal in both groups. However, serum FSH levels were significantly higher in the study group than in the controls (P < 0.05); LH and testosterone levels were similar in the two groups (Table I).
Semen analysis
Sperm parameters (excluding sperm volume and count) were below the WHO reference range in the study group (Table II), and sperm total motility, forward progression, functional tests and sperm kinetics were significantly lower than in controls (P < 0.0001). The mean sperm count was similar in the two groups (Table II).
Environmental pollutants and toxicological evaluation
Environmental levels of occupational pollutants (except CO) at the tollgates exceeded the maximum levels permitted by law. The study group was exposed to significantly higher levels of NOx (P < 0.0001), SOx (P < 0.0001), CO (P < 0.05) and Pb (P < 0.0001) than controls. Circulating levels of toxicological markers were within normal range, but MHb, SHb, blood Pb and ZnPP were significantly higher in the study group (P < 0.0001) (Table III).
Correlation analysis
As shown in Table IV, in the study group considered as a whole, sperm count was inversely correlated with blood Pb (P < 0.05), sperm total motility (P < 0.01), viability (P < 0.001) and membrane function (P < 0.01), and the CMPT (P < 0.01) and linearity of spermatic movement (P < 0.01) were inversely correlated with MHb concentration. In the study group there was an association between higher blood Pb levels and poor sperm quality. However, when the study group was divided according to WHO values (see above), there was no correlation in subset 1 (men with normal values). Conversely, in subset 2 there was a significant negative correlation between MHb and total motility (P < 0.0001), viability (P < 0.001), HOS (P < 0.01), the acridine orange test (P < 0.05), the CMPT (P < 0.05), LIN (P < 0.05) and ALH (P < 0.05), as well as between blood Pb and viability (P < 0.05), and between blood Pb and sperm count (P < 0.01) (Table V, Figure 1).
Discussion
The most relevant finding of this study is that all sperm parameters except mean sperm count and volume were deranged in subjects continuously exposed to environmental pollutants versus controls. In tollgate workers, sperm count was inversely correlated with circulating Pb levels, and total sperm motility, viability, membrane function, the CMPT and linearity of sperm lateral movement were inversely correlated with MHb levels. In the subset with deranged sperm parameters, both sperm count and viability were inversely correlated with Pb levels, and sperm motility, viability, membrane function, nuclear DNA integrity, linearity and amplitude of sperm lateral movement were inversely correlated with MHb levels.
The peculiarity of this study is that it was conducted with a homogeneous population of young to middle‐aged subjects equally and constantly exposed to occupation‐related environmental pollutants. In fact, they were exposed to vehicle‐discharged gases at their workplace, i.e. a small motorway tollbooth. The occupational exposure lasts 6 h a day in various work shifts. Consequently, all tollgate workers were exposed to the same environmental pollutants for the same length of time.
As expected, on‐site measurements (data not shown) showed that they were exposed to higher amounts of environmental pollutants (NO, SO, CO, Pb) than age‐matched controls. Higher circulating levels of MHb, SHb, Pb and ZnPP support this finding. The environmental concentrations of Pb, which were significantly higher in the study group versus control subjects, were consistent with blood Pb concentrations almost three times higher in the former. This finding is probably due to the tollgate workers’ continuous exposure to pollution. Prolonged sitting has also been implicated in poor semen quality. Figà‐Talamanca et al. (1996) found that prolonged sitting could increase temperature in the pelvic region, which in turn could determine semen deterioration. More recently, Bujan et al. (2000) reported elevated scrotal temperatures in car drivers. However, both our study group and control group had sedentary jobs.
There is a body of evidence linking blood Pb concentrations with sperm alterations. Lead exposure resulted in a decreased intertubular tissue volume in the testes of adult rats and a significant reduction of plasma testosterone (Thoreux‐Manlay et al., 1995). In cynomolgus monkey testes, chronic Pb treatment caused impairment of sperm chromatin (Foster et al., 1996) and ultrastructural alterations of Sertoli cells and of spermatogenetic cells (Foster et al., 1998). In mice, low doses of Pb reduced the number of sperm within the epididymis, and high doses reduced the sperm count percentage of motile sperm and increased the percentage of abnormal sperm within the epididymis (Wadi and Ahmad, 1999). The negative relationship between Pb and Zn was confirmed by the finding that Zn supplementation ameliorates Pb‐induced testicular damage at cellular and sub‐cellular levels in rats (Batra et al., 1998). More recently, it has been demonstrated that concomitant administration of Zn reduces Pb levels in rat testes, and improves the spermatogenesis arrested by Pb alone (Batra et al., 2001). Earlier findings showed asthenozoospermia and teratozoospermia in Pb‐exposed workers (Lerda, 1992), and decreased sperm count, suppressed FSH levels and decreased ventral prostate weight in experimental animals exposed to Pb (Sokol et al., 1998). Blood Pb levels >40 µg/dl increased the risk of impaired sperm concentration in men employed at a Pb smelter compared with individuals whose blood values were <15 µg/dl (Alexander et al., 1996). Increased circulating Pb levels are also associated with adverse changes in sperm count, ejaculate volume, percentage of motile sperm, swimming velocity and morphology (Moorman et al., 1998). Total sperm count and concentration were shown to decrease with increasing concentrations of blood Pb (Alexander et al., 1998). Blood Pb levels are also inversely correlated with the percentage of live sperm (Dawson et al., 1998). Telisman et al. (2000) found that even moderate exposure to Pb significantly reduced human semen quality but they did not find any conclusive evidence for Pb‐related derangement of male reproductive endocrine function.
Interestingly, Pb accumulates in male reproductive organs; human testes and sperm contain numerous potassium channels through which metallic toxicants can enter into mature sperm (Benoff et al., 2000). Pb can compete with, or even replace the Zn in human protamine at two different sites, so causing a conformational change in the protein. This interaction adversely affects sperm chromatin condensation (Quintanilla‐Vega et al., 2000). Bonde et al. (2002) recently observed that sperm concentration was reduced by ∼49% in men with a blood Pb concentration >50 µg/dl; however, there was no indication of a linear trend of lower sperm concentration with increasing blood Pb values, and sperm chromatin deterioration was not correlated with blood Pb concentration. Circulating Pb concentrations were higher in our tollgate workers (20.1 ± 0.6 µg/dl) than in controls but lower than those reached in workers at a Pb smelter (Alexander et al., 1996). Sperm count did not differ significantly between our study group and controls, whereas functional parameters, motility, functional test and sperm kinetics were significantly lower in the study group. This finding is in line with the report that spermatogenesis is impaired in men with high circulating Pb levels (Alexander et al., 1996). In fact, in our subjects who have ‘intermediate’ blood Pb levels, sperm functional activity was diminished. The difference between tollgate and Pb smelter workers is probably due to the fact that, although exposure to Pb was less intense in the former, it was continuous.
In agreement with previous findings (Ng et al., 1991), serum FSH levels were significantly higher in our study group than in controls; the mean sperm count was normal (World Health Organization, 1999) and similar to controls. However, blood Pb levels in the study group were inversely correlated with sperm count, suggesting that the absorption of environmental Pb at lower doses with respect to occupationally Pb‐exposed workers induced impairment of the ejaculates because of damage to the germinal epithelium and a subsequent increased pituitary FSH response. This is confirmed by the finding that most qualitative parameters (motility, viability, membrane function, DNA integrity, and kinetics) were impaired in the tollgate workers and were inversely related to MHb levels in the subset with abnormal parameters. Methaemoglobin level, which is a marker of NOx exposure, was increased in the study group. Our tollgate workers were undoubtedly exposed to high NOx levels and their increased MHb levels match this observation. The impaired patterns of sperm function correlated to MHb levels suggest that NO damages sperm (see Table III). In addition, the TTP was significantly longer in tollgate workers than in controls.
The usefulness of TTP data has been questioned. Baird et al. (1986) used TTP in epidemiological studies to evaluate the effects of pollutants on fertility. On the other hand it has been suggested that TTP is influenced by factors that could change over time or may differ among populations (Basso et al., 2000). Moreover, Slama et al. (2002) noted that morphologically normal sperm influences TTP regardless of sperm concentration. Similarly, Andersen et al. (2002) did not find an association between TTP and sperm count or sperm motility. In contrast, Sallmen (2001) demonstrated that male exposure to Pb is associated with delayed conception. Although, Apostoli et al. (2000) found no difference in fertility between Pb‐exposed and non‐exposed subjects, TTP was significantly longer at Pb exposure levels >40 µg/dl. Time to first pregnancy was higher in our tollgate workers than in controls even though blood Pb levels did not reach those reported by Apostoli et al. (2000). Our finding reinforces the concept that blood Pb levels do not necessarily reflect the effects induced by long‐term Pb exposure.
In conclusion, our study demonstrates that continuous exposure to traffic pollutants impairs sperm quality in young/middle‐aged men. The comparative evaluation of sperm parameters, absorption markers and environmental concentrations indicates that Pb is probably causing the impaired spermatogenesis. Alteration of sperm function could be considered a precocious marker of detrimental toxicological effects. The analysis of potential fertility of these workers after they have been removed from tollgate duty will add other important information to this intriguing issue. Although longitudinal data are necessary to identify the specific modifications induced by each pollutant on the male endocrine and reproductive system, our results will hopefully prompt clinical and epidemiological studies of male infertility in other work categories exposed to similar levels of environmental pollutants. Lastly, given the effect of pollution on our tollgate workers, health authorities should be alert to the insidious health effects of environmental pollution.
Acknowledgements
We acknowledge the excellent technical assistance provided by Mr Angelo Di Francia, and thank Jean Ann Gilder for text editing.
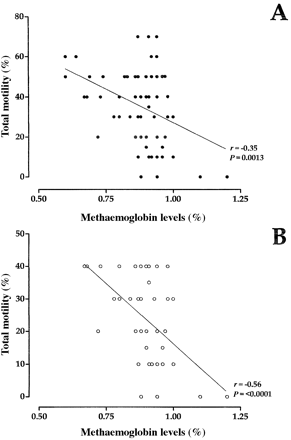
Figure 1. Correlation analysis between total sperm motility and methaemoglobin levels in the whole population of men exposed to air pollutants (A) and in the subset of the study group men with total sperm motility below the normal range (B).
Clinical and endocrine parameters in 85 men occupationally exposed to environmental pollutants compared with 85 control men randomly selected
| Controls | Study group | P‐value | ||||
| Mean ± SE | Range | Mean ± SE | Range | |||
| Age (years) | 39.6 ± 0.7 | 29–53 | 38.6 ± 0.8 | 23–62 | NS | |
| Married [no. (%)] | 63 (74.1) | – | 71 (83.5) | – | NSa | |
| Children (no.)b | 2.0 ± 0.1 | 0–4 | 1.8 ± 0.1 | 0–4 | NS | |
| TTP (mos.)b | 8.1 ± 0.4 | 0–15 | 15 ± 1.6 | 0–60 | < 0.0001 | |
| Serum FSH (IU/l) | 3.2 ± 0.2 | 0.9–6.3 | 4.1 ± 0.3 | 0.7–13.5 | < 0.05 | |
| Serum LH (IU/l) | 2.8 ± 0.1 | 0.9–5.4 | 2.8 ± 0.2 | 0.7–8.9 | NS | |
| Serum testosterone (µg/l) | 4.7 ± 0.2 | 2.9–10.8 | 4.8 ± 0.2 | 2.3–9.2 | NS | |
aχ2‐test.
bOnly married men.
TTP = time to induce the first pregnancy; NS = not significant.
Analysis of seminal parameters in 85 men occupationally exposed to environmental pollutants (SG) compared with 85 control men randomly recruited
| Controls | Study group | P‐value | ||||
| Mean ± SE | Range | Mean ± SE | Range | |||
| Sperm count (×106/ml) | 33.7 ± 1.6 | 20–70 | 32.4 ± 2.4 | 1–100 | NS | |
| Semen volume (ml) | 2.7 ± 0.1 | 2–4 | 2.5 ± 0.1 | 0.5–6 | NS | |
| Sperm total motility (%) | 56.8 ± 0.8 | 50–75 | 34.7 ± 2.2 | 0–70 | < 0.0001 | |
| Forward progression (%) | 28.7 ± 0.5 | 25–40 | 12.3 ± 1.2 | 0–40 | < 0.0001 | |
| Eosin test (%) | 80.7 ± 0.6 | 75–90 | 51.7 ± 2.5 | 15–95 | < 0.0001 | |
| Hypo‐osmotic swelling test (%) | 65.4 ± 0.6 | 60–75 | 43.4 ± 2.2 | 5–85 | < 0.0001 | |
| Acridine orange test (%) | 75.7 ± 0.6 | 70–85 | 48.5 ± 2.2 | 10–85 | < 0.0001 | |
| CMPT (mm) | 30.3 ± 0.2 | 27–37 | 15.9 ± 1.2 | 0–34 | < 0.0001 | |
| VSL (µm/s) | 34.4 ± 0.6 | 27–48 | 16.1 ± 1.3 | 0–42.7 | < 0.0001 | |
| VCL (µm/s) | 52.6 ± 0.6 | 46–68 | 29.7 ± 2.0 | 0–63.6 | < 0.0001 | |
| LIN (VSL/VCL) (%) | 65.8 ± 1.1 | 58–102 | 47.1 ± 1.7 | 0–73.2 | < 0.0001 | |
| ALH (µm) | 2.7 ± 0.1 | 1.6–4.9 | 1.9 ± 0.1 | 0–4.1 | < 0.0001 | |
CMPT = bovine cervical mucus penetration test; VSL = sperm linear velocity; VCL = sperm curvilinear velocity; LIN = linearity of sperm motion; ALH = amplitude of lateral movement of sperm head; NS = not significant.
Concentrations of toxicological markers in 85 men occupationally exposed to environmental pollutants compared with 85 control men randomly selected and levels of environmental pollutants for both groups
| Controls | Study group | P | ||||
| Mean ± SE | Range | Mean ± SE | Range | |||
| Methaemoglobin (%) | 0.7 ± 0.01 | 0.5–0.9 | 0.9 ± 0.01 | 0.6–1.2 | < 0.0001 | |
| Sulphaemoglobin (%) | 0.7 ± 0.01 | 0.6–0.6 | 0.9 ± 0.01 | 0.8–1.2 | < 0.0001 | |
| Carboxyhaemoglobin (%) | 4.4 ± 0.2 | 1.0–7.9 | 4.6 ± 0.2 | 2.3–10.4 | NS | |
| Blood Pb (µg/dl) | 7.4 ± 0.5 | 1.3–16.5 | 20.1 ± 0.6 | 10–32 | < 0.0001 | |
| Zinc‐protoporphyrin (µg/dl) | 22.4 ± 0.7 | 10–32 | 35.4 ± 1.2 | 20–88 | < 0.0001 | |
| Nitrogen oxides (mg/m3) | 151.2 ± 3.5 | 58–183 | 301.3 ± 9.6 | 115–398 | < 0.0001 | |
| Sulphur oxides (µg/m3) | 44.6 ± 1.9 | 17–83 | 158.4 ± 5.7 | 45–343 | < 0.0001 | |
| Carbon monoxide (mg/m3) | 14.9 ± 0.3 | 10–23 | 16.4 ± 0.5 | 9–27 | < 0.05 | |
| Atmospheric Pb (µg/m3) | 2.1 ± 0.1 | 0.9–3.4 | 2.8 ± 0.1 | 1.2–4.2 | < 0.0001 | |
Linear regression analysis between seminal parameters and methaemoglobin and Pb level in the 85 men occupationally exposed to environmental pollutants
| β | 95% CI of β | r | P‐value | |
| Methaemoglobin level versus: | ||||
| Sperm total motility (%) | –66.918 | –106.906 to –26.931 | –0.355 | < 0.01 |
| Eosin test (%) | –80.271 | –125.461 to –35.082 | –0.3739 | < 0.001 |
| Hypo‐osmotic swelling test (%) | –60.658 | –103.303 to –18.012 | –0.3072 | < 0.01 |
| Acridine orange test (%) | 9.037 | –31.254 to 49.329 | 0.05 | NS |
| Cervical mucus penetration test (mm) | –35.927 | –57.496 to 14.337 | –0.3536 | < 0.01 |
| Linearity of spermatic movement | –44.945 | –78.362 to –11.528 | –0.2919 | < 0.01 |
| Amplitude of lateral movement of sperm head (µm) | –2.439 | –5.307 to 0.430 | –0.2163 | NS |
| Blood Pb level versus: | ||||
| Sperm count (106/ml) | –0.8622 | –1.655 to –0.0696 | –0.2623 | < 0.05 |
| Eosin test (%) | –0.2520 | –1.129 to 0.6256 | –0.0715 | NS |
β = slope of linear regression; CI = confidence interval; r = Pearson correlation coefficient; NS = not significant.
Linear regression analysis between seminal parameters and methaemoglobin and Pb level in the 2nd subset of study group (52 subjects with total sperm motility lower than World Health Organization criteria)
| β | 95% CI of β | r | P‐value | |
| Methaemoglobin level versus: | ||||
| Sperm total motility (%) | –73.999 | –105.417 to –42.580 | –0.5561 | < 0.0001 |
| Eosin test (%) | –73.114 | –113.092 to –33.136 | –0.461 | < 0.001 |
| Hypo‐osmotic swelling test (%) | –56.986 | –93.1 to –20.871 | –0.409 | < 0.01 |
| Acridine orange test (%) | –50.413 | –90.056 to –10.769 | –0.3397 | < 0.05 |
| Cervical mucus penetration test (mm) | –28.484 | –61.675 to 4.706 | –0.2368 | NS |
| Linearity of sperm movement (%) | –50.818 | –92.483 to –9.154 | –0.3274 | < 0.05 |
| Amplitude of lateral movement of sperm head (µm) | –3.205 | –6.16 to –0.250 | –0.2944 | < 0.05 |
| Blood Pb level versus: | ||||
| Sperm count (106/ml) | –1.325 | –2.176 to –0.4727 | –0.4360 | < 0.01 |
| Eosin test (%) | –0.8937 | –1.634 to –0.1539 | –0.3522 | < 0.05 |
β = slope of linear regression; CI = confidence interval; r = Pearson correlation coefficient; NS = not significant.
References
Alexander, B.H., Checkoway, H., van Netten, C., Muller, C.H., Ewers, T.G., Kaufman, J.D., Mueller, B.A., Vaughan, T.L. and Faustman, E.M. (
Alexander, B.H., Checkoway, H., Faustman, E.M., van Netten, C., Muller, C.H. and Ewers, T.G. (
Andersen, A.G., Ziebe, S., Jorgensen, N., Petersen, J.H., Skakkebaek, N.E. and Andersen, A.N. (
Apostoli, P., Bellini, A., Porru, S. and Bisanti, L. (
Baird, D.D., Wilcox, A.J. and Weinberg, C.R. (
Basso, O., Juul, S. and Olsen, J. (
Batra, N., Nehru, B. and Bansal, M.P. (
Batra, N., Nehru, B. and Bansal, M.P. (
Benoff, S., Jacob, A. and Hurley, I.R. (
Bonde, J.P., Joffe, M., Apostoli, P., Dale, A., Kiss, P., Spano, M., Caruso, F., Giwercman, A., Bisanti, L., Porru, S., Vanhoorne, M., Comhaire, F. and Zschiesche, W. (
Branderberger, H. (
Bujan, L., Daudin, M., Charlet, J.P., Thonneau, P. and Mieusset, R. (
Carlsen, E., Giwercman, A., Keiding, N. and Skakkebaek, N.E. (
Colborn, T., vom Saal, F.S. and Soto, A.M. (
Daston, G.P., Gooch, J.W., Breslin, W.J., Shuey, D.L., Nikiforov, A.I., Fico, T.A. and Gorsuch, J.W. (
Dawson, E.B., Ritter, S., Harris, W.A., Evans, D.R. and Powell, L.C. (
Figà‐Talamanca, I., Dell’Orco, V., Pupi, A., Dondero, F., Gandini, L., Lenzi, A., Lombardo, F., Scavalli, P. and Mancini, G. (
Figà‐Talamanca, I., Cini, C., Varricchio, G.C., Dondero, F., Gandini, L., Lenzi, A., Lombardo, F., Angelucci, L., Di Grezia, R. and Patacchioli, F.R. (
Forti, G. and Serio, M. (
Foster, W.G., McMahon, A. and Rice, D.C. (
Foster, W.G., Singh, A., McMahon, A. and Rice, D.C. (
Hovatta, O., Venalainen, E.R., Kuusimaki, L., Heikkila, J., Hirvi, T. and Reima, I. (
Jensen, T.K., Carlsen, E., Jorgensen, E., Berthelsen, J.G., Keiding, N., Christensen, K., Petersen, J.H., Knudsen, L.B. and Skakkebaek, N.E. (
Kelner, M.J. and Bailey, D.N. (
Lahdetie, J. (
Lerda, D. (
Moorman, W.J., Skaggs, S.R., Clark, J.C., Turner, T.W., Sharpnack, D.D., Murrell, J.A., Simon S.D., Chapin, R.E. and Schrader, S.M. (
Ng, T.P., Goh, H.H., Ng, H.Y., Ong, H.Y., Ong, C.N., Chia, K.S., Chia, S.E. and Jeyaratnam, J. (
Quintanilla‐Vega, B., Hoover, D.J., Bal, W., Silbergeld, E.K., Waalkes, M.P. and Anderson, L.D. (
Sallmen, M. (
Sallmen, M., Lindbohm, M.L., Anttila, A., Taskinen, H. and Hemminki, K. (
Schifman, R.B. and Finley, P.R. (
Slama, R., Eustache, F., Ducot, B., Jensen, T.K., Jorgensen, N., Horte, A., Irvine, S., Suominen, J., Andersen, A.G., Auger, J. et al. (
Sokol, R.Z., Madding, C.E. and Swerdloff, R.S. (
Sultan, C., Balaguer, P., Terouanne, B., Georget, V., Paris, F., Jeandel, C., Lumbroso, S. and Nicolas, J. (
Telisman, S., Cvitkovic, P., Jurasovic, J., Pizent, A., Gavella, M. and Rocic, B. (
Thonneau, P. (
Thoreux‐Manlay, A., Velez de la Calle, J.F., Olivier, M.F., Soufir, J.C., Masse, R. and Pinon‐Lataillade, G. (
Tielemans, E., Burdorf, A., te Velde, E.R., Weber, R.F., van Kooij, R.J., Veulemans, H. and Heederik, D.J. (
Tyler, C.R., Jobling, S. and Sumpter, J.P. (
Veulemans, H., Steeno, O., Masschelein, R. and Groeseneken, D. (
Viskum, S., Rabjerg, L., Jorgensen, P.J. and Grandjean, P. (
Wadi, S.A. and Ahmad, G. (
Watanabe, N. and Oonuki, Y. (
Whorton, D., Krauss, R.M., Marshall, S. and Milby, T.H. (
Whorton, D., Milby, T.H., Krauss, R.M. and Stubbs, H.A. (
